
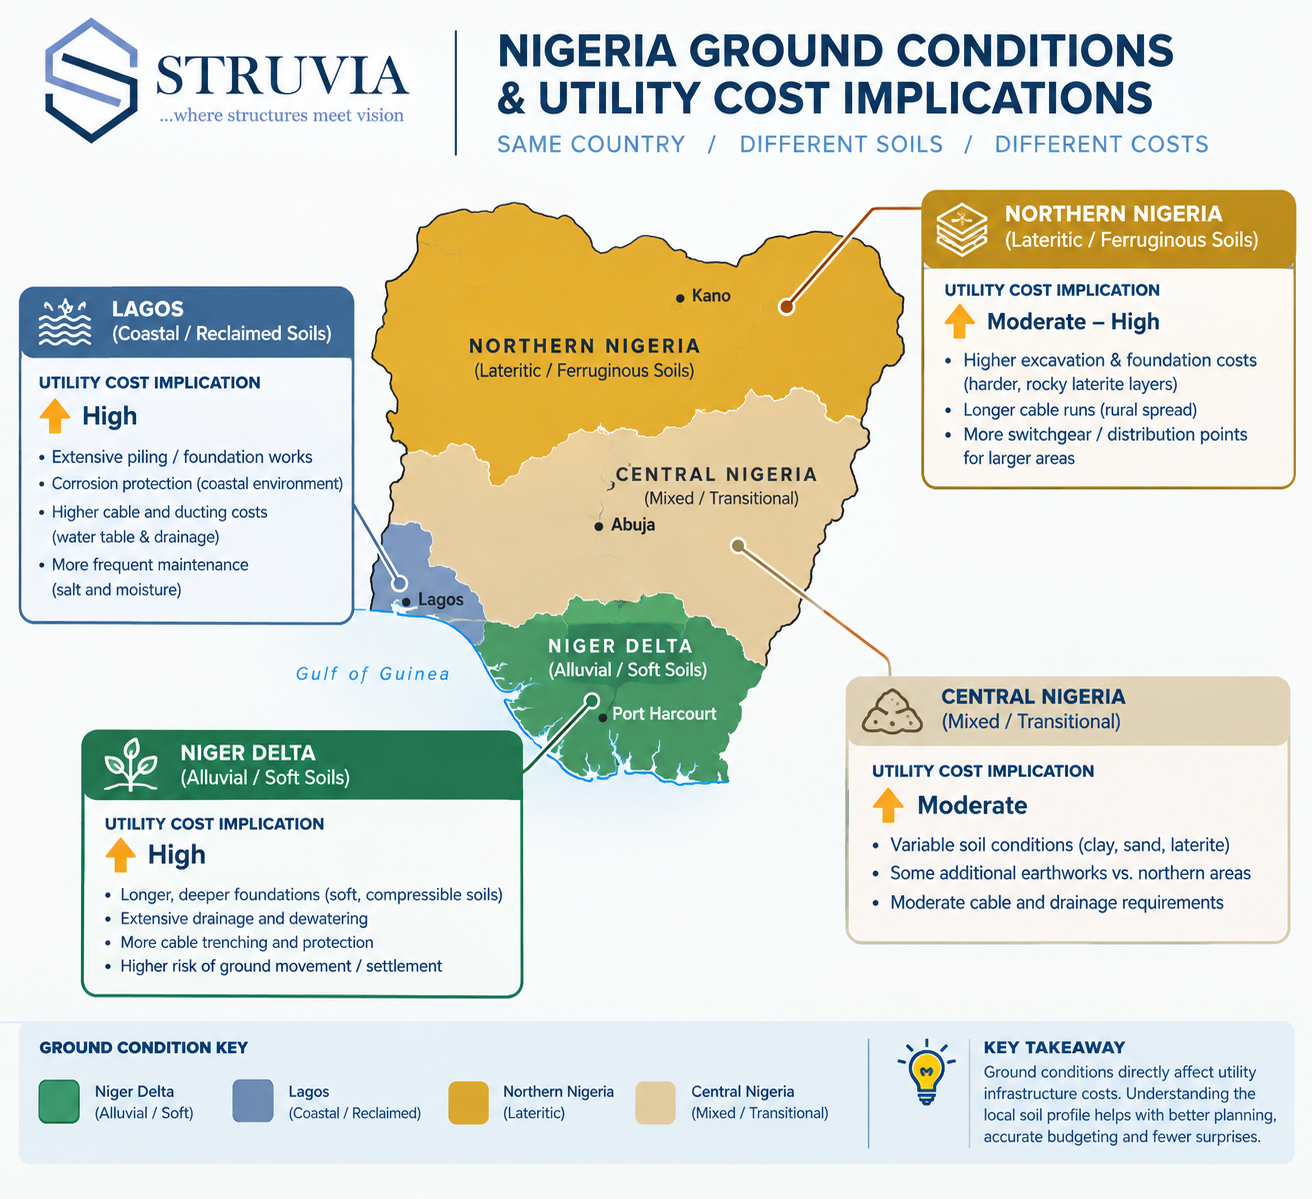
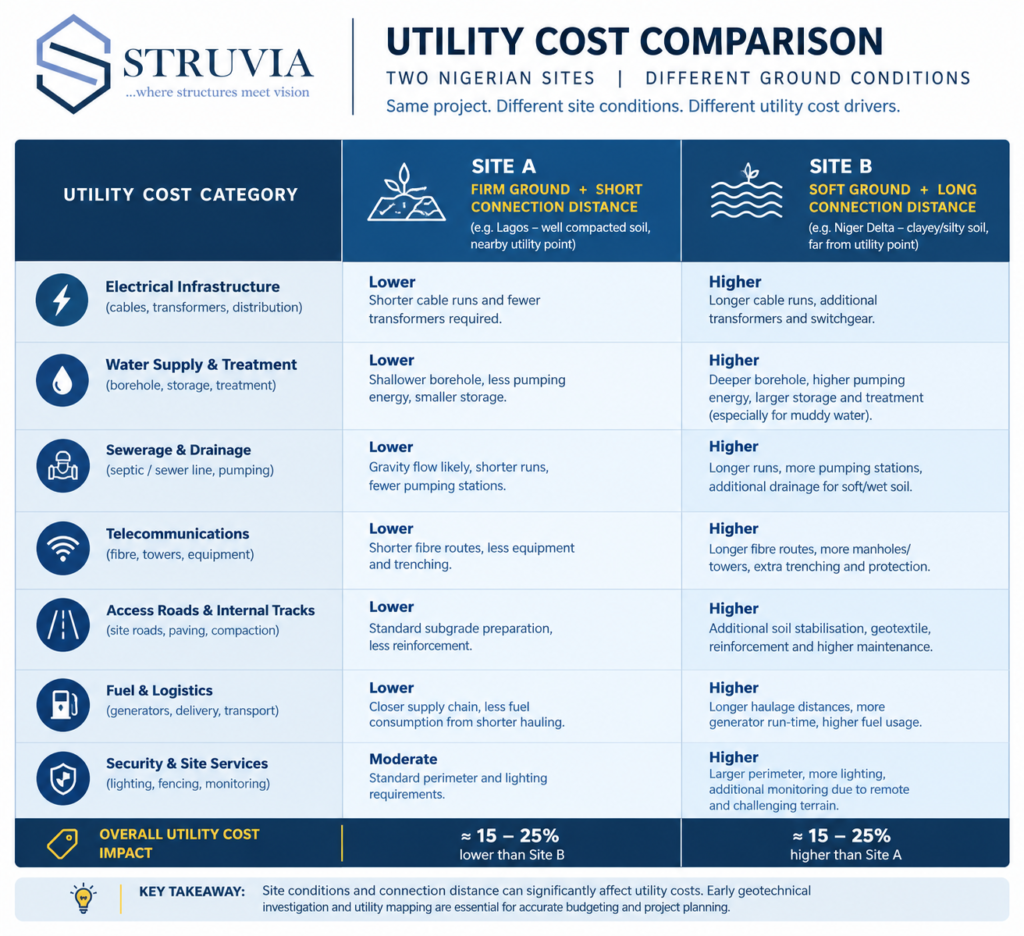
Two sites of near-identical size, ten kilometres apart in the same state, can carry utility budgets that differ by a wide margin, and the reason rarely shows up in a generic per-square-metre allowance. One sits on firm lateritic ground with a shallow water table and a straightforward Discos connection nearby. The other sits on soft alluvial soil, needs a longer cable run to reach the nearest substation with spare capacity, and crosses a water main that requires a full diversion rather than simple protection. Utility infrastructure cost factors are the specific, site-level variables that explain gaps like this, and pricing a project without accounting for them is how utility budgets end up as the least reliable line in the whole estimate. This piece sets out what those variables actually are, why they move the number so much, and how to price a specific site rather than a generic average.
Utility Infrastructure Cost Factors: Quick Answer
Utility infrastructure cost factors are the site-specific variables that determine what water, power, telecom, and gas connections and diversions actually cost, including soil conditions, distance to the nearest utility network with spare capacity, whether an existing service needs protection or full diversion, and which state and Discos franchise area the site sits in.
The Two Cost Categories Behind Every Utility Budget
Every utility cost estimate splits into protecting what already exists and paying for what the project newly needs, and the two categories respond to completely different cost drivers. Pricing them together under one generic allowance is the single most common reason utility budgets miss their target, because a site can be cheap on one side of this split and expensive on the other. The same discipline applies across other Nigerian infrastructure cost categories: a team that has priced foundation design cost factors site-specifically rather than from a flat allowance will recognise the same pattern here, since ground conditions drive both foundation and utility costs in similar ways.
Existing-Service Protection and Diversion Costs
Protecting an asset in place, concrete surround, sleeving, or a marked exclusion zone, is consistently the cheaper option where the design allows it, since it avoids the permit, design, and reinstatement costs a full diversion carries. Diversion cost scales with how far the asset must move and how many separate property or right-of-way boundaries the new route crosses; a shallow cable diversion of a few metres within a single plot costs a fraction of a water main diversion that needs a new easement across a neighbouring parcel. Depth matters as much as distance: a service buried below standard depth of cover, common where multiple utility owners have laid successive services in the same corridor over the years, costs more to expose and divert safely than one at typical depth.
Reinstatement cost after a diversion is often underpriced separately from the diversion work itself. Restoring a road surface, a paved area, or landscaping to its original condition after excavation is a distinct cost line with its own specification requirements, particularly where the affected surface belongs to a public road authority rather than the project site itself. Budgeting reinstatement as an afterthought within the general excavation allowance, rather than pricing it against the specific surface being disturbed, is a frequent source of the small but persistent cost overruns that accumulate across a project with multiple diversion points.
New-Connection and Capacity Costs
New-connection costs depend heavily on how much spare capacity already exists nearby. A site close to a substation with headroom pays a straightforward connection fee. A site that needs a capacity upgrade, whether a larger transformer or a new feeder line from the Discos network, can see the utility line item multiply several times over, and the Discos may require the developer to fund some or all of that upgrade directly as a condition of connection. Water and telecom follow the same logic: distance to the nearest main or duct with available capacity is usually a better cost predictor than the size of the project itself.
Embedded generation, a project-owned transformer, generator bank, or solar-plus-storage system sized to cover some or all of the site’s own load, changes this cost equation in both directions. It adds significant upfront capital cost, but it can remove the need for an expensive grid capacity upgrade entirely, and for sites in areas with poor grid reliability it also reduces ongoing operational risk that a pure grid connection would carry. Pricing both the grid-upgrade route and the embedded-generation route before committing lets a project team choose based on total cost of ownership rather than the lower headline figure alone.
What Drives Utility Cost Variation Across Nigerian Sites
Two sites can have identical scope on paper and still land on very different utility budgets once ground conditions and location are factored in. Recognising which variables matter most lets a project team price a specific site rather than borrowing a number from the last project.
Soil and Ground Conditions
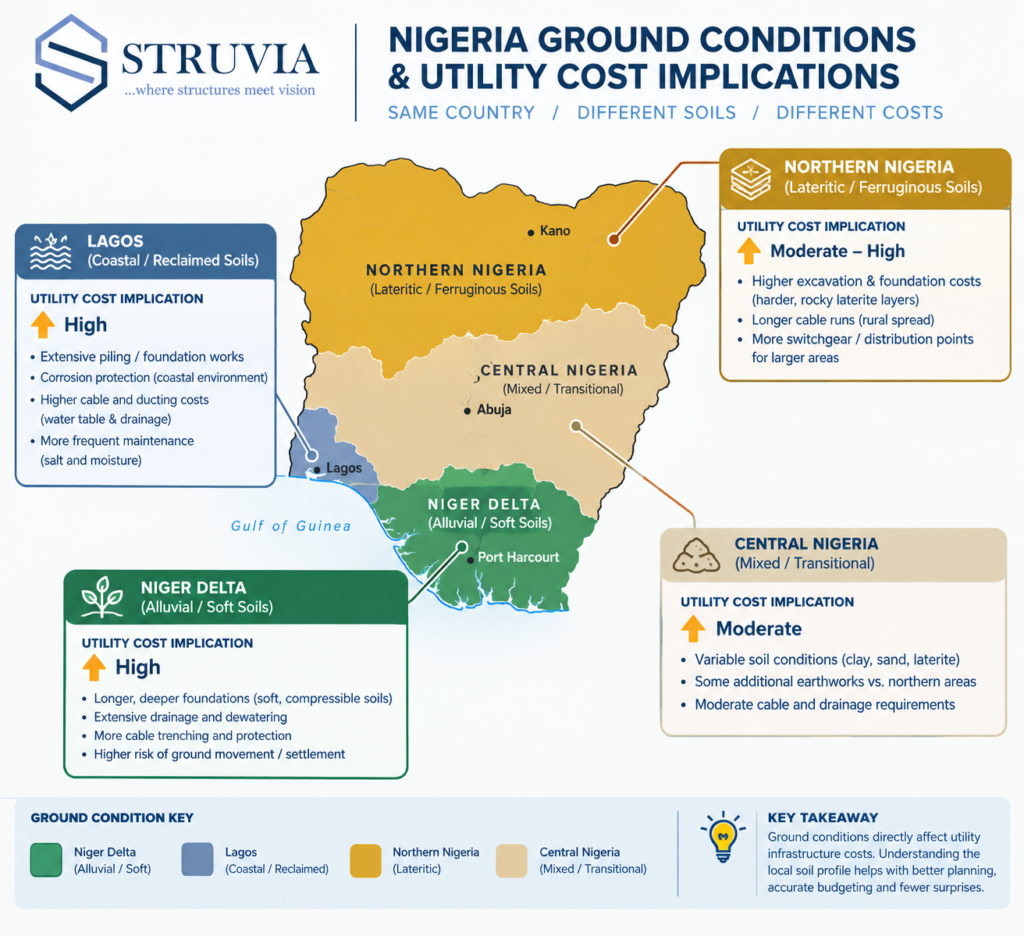
Excavation and detection costs rise directly with how difficult the ground is to work. The high-water-table alluvial soils common across the Niger Delta slow trial-pit excavation and reduce ground-penetrating radar reliability, pushing more of the detection budget toward physical verification methods that cost more per metre surveyed. Lateritic soils across much of the north generally excavate and detect more predictably, which keeps both survey and diversion costs closer to standard rates. A project team that has already reviewed hydraulic engineering cost factors for the same region often has usable groundwater and soil data that would otherwise need a separate utility-specific survey to establish.
State and Franchise Area Differences
Discos tariff structures, State Water Corporation connection fees, and building permit utility-clearance requirements all vary by state, and a cost benchmark from one franchise area does not transfer cleanly to another. A project spanning a state boundary, or even crossing between two local government areas with different building control practices, should treat each portion of the site as its own utility cost exercise rather than averaging a single rate across the whole boundary.
Utility Cost Factors Within Nigeria’s Regulatory and Market Context
Several cost components sit outside site conditions entirely and instead come from the regulatory and market environment utility work operates within. Permit and wayleave application fees are generally modest individually but add up across the five or six separate utility owners a typical site needs to coordinate with, and each comes with its own administrative lead time that has a real cost even when the fee itself is small. Where a pipeline right-of-way is involved in Niger Delta corridors, NUPRC clearance and any required compensation to affected landholders can add a substantial and specifically-negotiated cost that a generic utility allowance will never anticipate.
Material costs for cable, HDPE pipe, and telecom duct are meaningfully exposed to naira-to-USD exchange rate movement, since much of the raw material or finished product behind these items is imported or priced against an imported benchmark. A utility budget fixed months before procurement can drift materially by the time cable or pipe is actually ordered, which argues for pricing material-heavy diversion or new-connection work closer to the procurement date rather than locking a rate at feasibility stage. Any diversion design requiring COREN-registered sign-off also carries a professional fee that scales with design complexity rather than physical distance, worth budgeting separately from the construction cost itself.
Labour and plant hire rates for utility-specific work, trial-pit excavation crews, cable-jointing specialists, and pipe-welding teams, carry their own regional pricing pattern that does not always track general construction labour rates. Lagos and Port Harcourt, with denser concentrations of specialist utility contractors, tend to offer more competitive rates through genuine competition between providers, while a project in a smaller state capital may face a thinner contractor pool and correspondingly less price tension on specialist utility work specifically, even where general construction labour is cheaper overall.
Common Utility Budgeting Mistakes
The same handful of budgeting mistakes recur across Nigerian projects regardless of scale. Pricing utilities from a single per-square-metre allowance rather than a site-specific assessment is the most common, and it fails precisely because the cost drivers described above vary so much by location and ground condition that no single average rate captures them. Underestimating contingency for existing-service risk is a close second: a detection survey that returns unverified or partially-confirmed asset positions carries real cost uncertainty that a fixed allowance does not reflect, and treating every asset as if it were fully confirmed at feasibility stage understates the risk a project is actually carrying.
A third mistake specific to utility costs is failing to separate professional fees from construction cost within the estimate. COREN-registered sign-off on a diversion design, detection survey fees, and any specialist ground investigation needed to support the design all sit outside the physical construction cost, but project teams frequently fold them into a single “utilities” figure that makes it difficult to see which component is actually driving the total. Tracking these fee categories separately, even at feasibility stage when the numbers are still approximate, makes later cost control meaningfully easier.
Sequencing mistakes compound the cost problem further. Deferring utility cost confirmation until permits are already submitted means a capacity shortfall or an unexpected diversion requirement surfaces after the budget is fixed rather than while it can still be adjusted. A team following the phased approach in a full utility infrastructure guide tends to catch these cost drivers at feasibility stage specifically because the guide treats cost confirmation as part of the planning phase rather than something that happens once permits are underway.
Building a Realistic Utility Cost Estimate
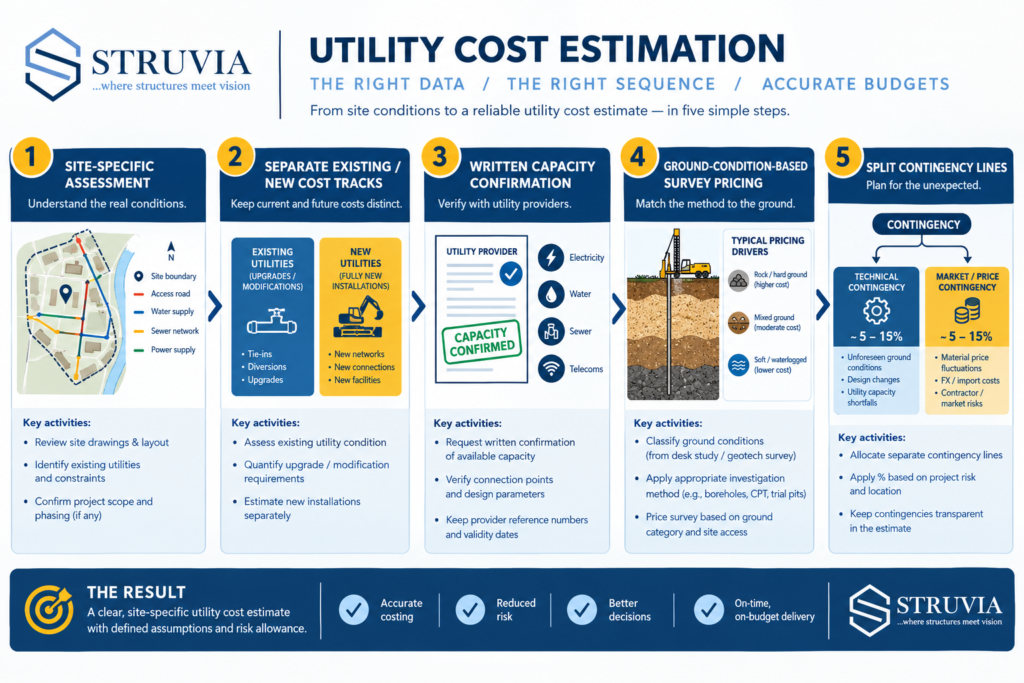
Start every utility cost estimate from the site’s own conditions rather than a benchmark from a previous project, even one in the same city, and separate the estimate into existing-service costs and new-connection costs from the first draft rather than combining them into one figure. Request a Discos capacity indication in writing before finalising the new-connection budget; a verbal assurance that “capacity is available” is not sufficient basis for a fixed price, since the formal load assessment can return a different answer once submitted. Price detection survey work against the specific ground conditions the site actually has, using regional data from comparable projects where available, rather than a flat rate per linear metre that ignores whether the ground is soft alluvial soil or firm laterite.
Build separate contingency lines for existing-service risk and new-connection risk rather than one combined percentage, since the two carry different levels of uncertainty and collapsing them into a single number hides which risk is actually driving the number. Where your project has already worked through a utility infrastructure assessment and a full utilities checklist, the detection results from that process should replace the generic contingency assumption with a confidence-graded, asset-by-asset cost picture, which is a materially better basis for a fixed budget than an allowance carried from feasibility stage.
Revisit the estimate at each major project milestone rather than treating the feasibility-stage figure as fixed. A budget confirmed after the detection survey, again after permits are secured, and again once material procurement is locked in reflects progressively better information at each stage, and catching a cost movement early at any one of these checkpoints is consistently cheaper than absorbing it as a change order once construction is underway.
Frequently Asked Questions About Utilities
Q: What are the biggest utility infrastructure cost factors on a Nigerian project?
A: The largest factors are typically whether existing services need protection or full diversion, how far a new connection must run to reach spare capacity, soil and ground conditions affecting detection and excavation, and which state and Discos franchise area the site sits in, since permit processes and tariffs vary by location.
Q: How much does a utility diversion cost compared to protection in place?
A: Protection in place is almost always cheaper, since it avoids the permit, design, and reinstatement costs a diversion carries. Diversion cost then scales mainly with distance moved and how many separate ownership or right-of-way boundaries the new route crosses, rather than with the size of the asset itself.
Q: Why do utility costs vary so much between Nigerian states?
A: Each state operates its own Water Corporation with its own fee structure, sits within a specific Discos franchise area with its own tariff and capacity situation, and applies its own building permit utility-clearance requirements. A cost benchmark from one state does not reliably transfer to another.
Q: How does exchange rate movement affect utility infrastructure costs?
A: Cable, HDPE pipe, and telecom duct pricing are exposed to naira-to-USD movement because much of the material is imported or priced against an imported benchmark. Budgets fixed well before procurement can drift materially by order time, which is a reason to price material-heavy utility work closer to the actual procurement date where the programme allows it.
Q: How much contingency should a project budget for utility infrastructure risk?
A: There is no single correct percentage, because it depends on how confirmed the existing-service data actually is. A site with a full confidence-graded detection survey needs less contingency than one relying on unverified desk records alone, which is why separating existing-service and new-connection contingency lines, rather than using one flat percentage, produces a more defensible budget.
Q: Can utility infrastructure costs be estimated before a detection survey is complete?
A: Only approximately. A feasibility-stage estimate based on records and regional benchmarks is useful for early budgeting, but it should be treated as a placeholder with wide contingency until a detection survey confirms actual asset positions and confidence levels, at which point the estimate can be tightened significantly.
Utility infrastructure cost factors are specific and site-dependent, not generic, and a budget built from a flat allowance will consistently miss on projects where ground conditions, connection distance, or franchise area push the real cost in either direction. Separate existing-service costs from new-connection costs from the first budget draft, confirm capacity and permit requirements in writing before pricing gets fixed, and build contingency lines that reflect how confirmed your utility data actually is rather than a single flat percentage. If your project needs a site-specific utility cost assessment before the budget is locked, StruviaCore’s engineering team can build that estimate from your actual site conditions rather than a generic benchmark.
Leave a Reply